
Exercise 3
Exercise 3 with matplotlib.
import numpy as np
import matplotlib.pyplot as plt
plt.figure(figsize=(8, 5), dpi=80)
plt.subplot(111)
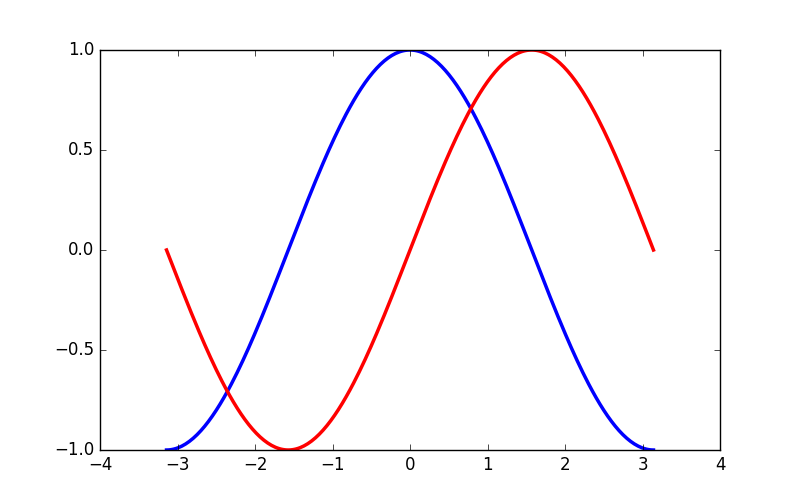
X = np.linspace(-np.pi, np.pi, 256, endpoint=True)
C, S = np.cos(X), np.sin(X)
plt.plot(X, C, color="blue", linewidth=2.5, linestyle="-")
plt.plot(X, S, color="red", linewidth=2.5, linestyle="-")
plt.xlim(-4.0, 4.0)
plt.xticks(np.linspace(-4, 4, 9, endpoint=True))
plt.ylim(-1.0, 1.0)
plt.yticks(np.linspace(-1, 1, 5, endpoint=True))
plt.show()
Total running time of the script: ( 0 minutes 0.056 seconds)