
Axes
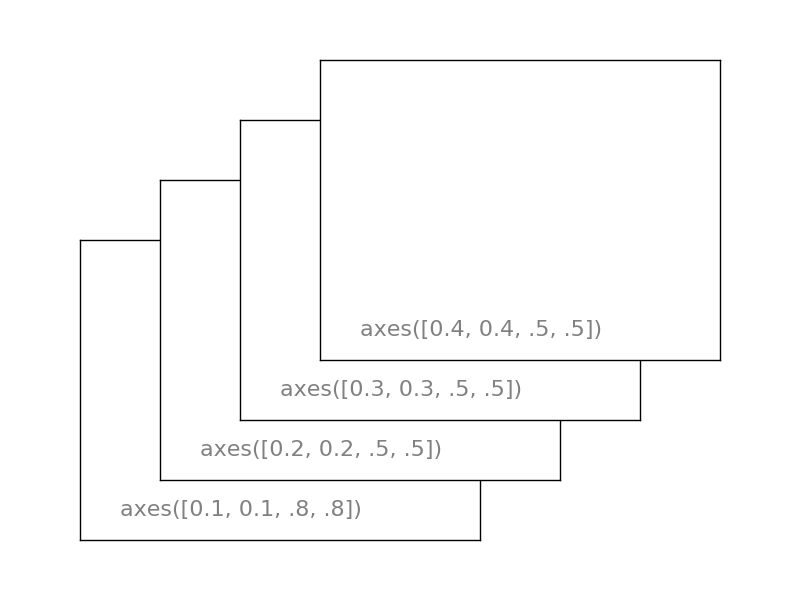
This example shows various axes command to position matplotlib axes.
import matplotlib.pyplot as plt

plt.axes([.1, .1, .5, .5])
plt.xticks(())
plt.yticks(())
plt.text(0.1, 0.1, 'axes([0.1, 0.1, .8, .8])', ha='left', va='center',
        size=16, alpha=.5)

plt.axes([.2, .2, .5, .5])
plt.xticks(())
plt.yticks(())
plt.text(0.1, 0.1, 'axes([0.2, 0.2, .5, .5])', ha='left', va='center',
        size=16, alpha=.5)

plt.axes([0.3, 0.3, .5, .5])
plt.xticks(())
plt.yticks(())
plt.text(0.1, 0.1, 'axes([0.3, 0.3, .5, .5])', ha='left', va='center',
        size=16, alpha=.5)

plt.axes([.4, .4, .5, .5])
plt.xticks(())
plt.yticks(())
plt.text(0.1, 0.1, 'axes([0.4, 0.4, .5, .5])', ha='left', va='center',
        size=16, alpha=.5)

plt.show()
Total running time of the script: ( 0 minutes 0.139 seconds)