
Plot and filled plots
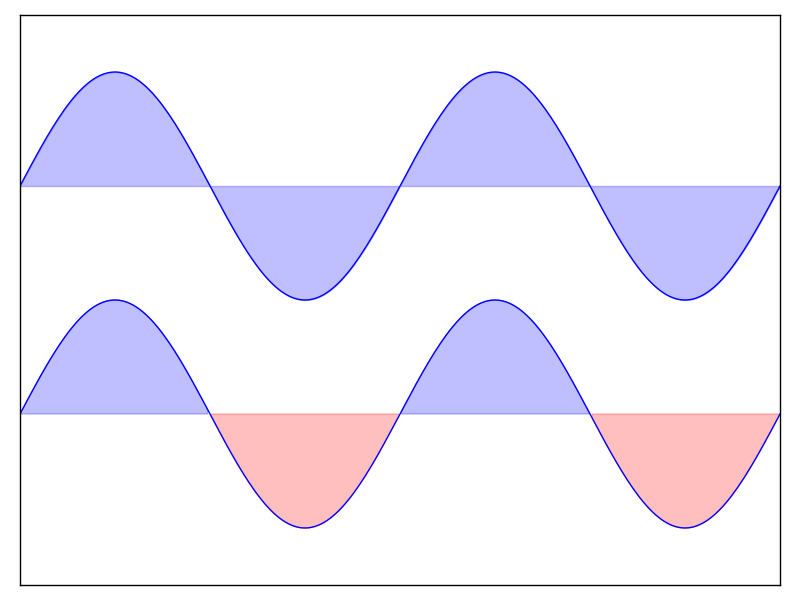
Simple example of plots and filling between them with matplotlib.
import numpy as np
import matplotlib.pyplot as plt

n = 256
X = np.linspace(-np.pi, np.pi, n, endpoint=True)
Y = np.sin(2 * X)

plt.axes([0.025, 0.025, 0.95, 0.95])

plt.plot(X, Y + 1, color='blue', alpha=1.00)
plt.fill_between(X, 1, Y + 1, color='blue', alpha=.25)

plt.plot(X, Y - 1, color='blue', alpha=1.00)
plt.fill_between(X, -1, Y - 1, (Y - 1) > -1, color='blue', alpha=.25)
plt.fill_between(X, -1, Y - 1, (Y - 1) < -1, color='red',  alpha=.25)

plt.xlim(-np.pi, np.pi)
plt.xticks(())
plt.ylim(-2.5, 2.5)
plt.yticks(())

plt.show()
Total running time of the script: ( 0 minutes 0.049 seconds)