
Boxplot with matplotlib
An example of doing box plots with matplotlib
import numpy as np
import matplotlib.pyplot as plt
fig = plt.figure(figsize=(8, 5))
axes = plt.subplot(111)
n = 5
Z = np.zeros((n, 4))
X = np.linspace(0, 2, n, endpoint=True)
Y = np.random.random((n, 4))
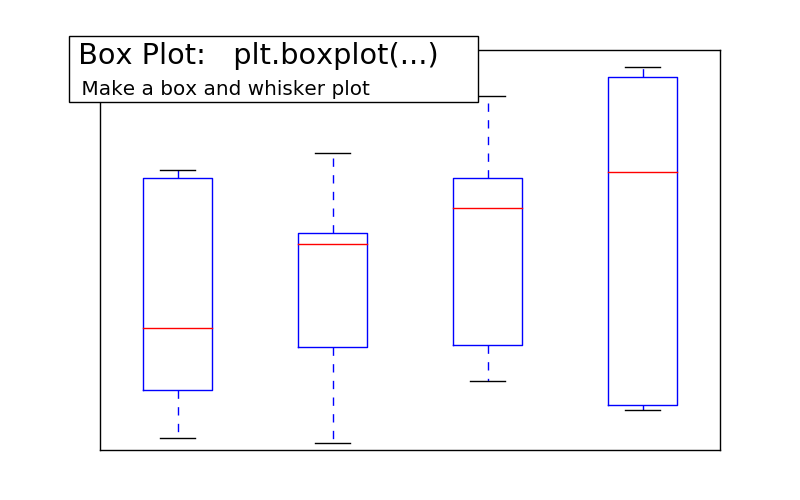
plt.boxplot(Y)
plt.xticks(())
plt.yticks(())
# Add a title and a box around it
from matplotlib.patches import FancyBboxPatch
ax = plt.gca()
ax.add_patch(FancyBboxPatch((-0.05, .87),
width=.66, height=.165, clip_on=False,
boxstyle="square,pad=0", zorder=3,
facecolor='white', alpha=1.0,
transform=plt.gca().transAxes))
plt.text(-0.05, 1.02, " Box Plot: plt.boxplot(...)\n ",
horizontalalignment='left',
verticalalignment='top',
size='xx-large',
transform=axes.transAxes)
plt.text(-0.04, .98, "\n Make a box and whisker plot ",
horizontalalignment='left',
verticalalignment='top',
size='large',
transform=axes.transAxes)
plt.show()
Total running time of the script: ( 0 minutes 0.075 seconds)