
3D plotting vignette
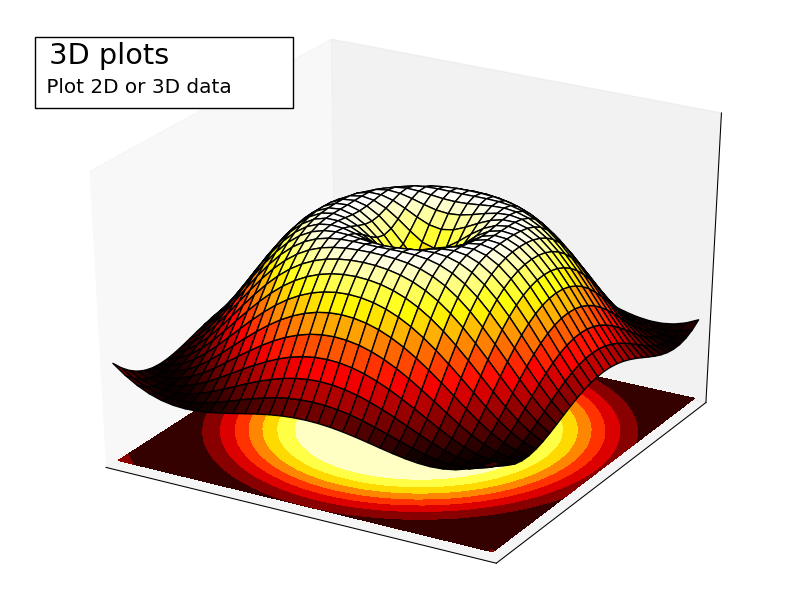
Demo 3D plotting with matplotlib and decorate the figure.
import numpy as np
import matplotlib.pyplot as plt
from mpl_toolkits.mplot3d import Axes3D

fig = plt.figure()
ax = Axes3D(fig)
X = np.arange(-4, 4, 0.25)
Y = np.arange(-4, 4, 0.25)
X, Y = np.meshgrid(X, Y)
R = np.sqrt(X ** 2 + Y ** 2)
Z = np.sin(R)

ax.plot_surface(X, Y, Z, rstride=1, cstride=1, cmap=plt.cm.hot)
ax.contourf(X, Y, Z, zdir='z', offset=-2, cmap=plt.cm.hot)
ax.set_zlim(-2, 2)
plt.xticks(())
plt.yticks(())
ax.set_zticks(())

ax.text2D(0.05, .93, " 3D plots             \n",
          horizontalalignment='left',
          verticalalignment='top',
          size='xx-large',
          bbox=dict(facecolor='white', alpha=1.0),
          transform=plt.gca().transAxes)

ax.text2D(0.05, .87, " Plot 2D or 3D data",
          horizontalalignment='left',
          verticalalignment='top',
          size='large',
          transform=plt.gca().transAxes)

plt.show()
Total running time of the script: ( 0 minutes 0.176 seconds)