
1.5.12.5. Explore signal filtering with scipy.signal
Look at median filtering and wiener filter: two non-linear low-pass filters.
Generate a signal with some noise
import numpy as np
np.random.seed(0)
t = np.linspace(0, 5, 100)
x = np.sin(t) + .1 * np.random.normal(size=100)
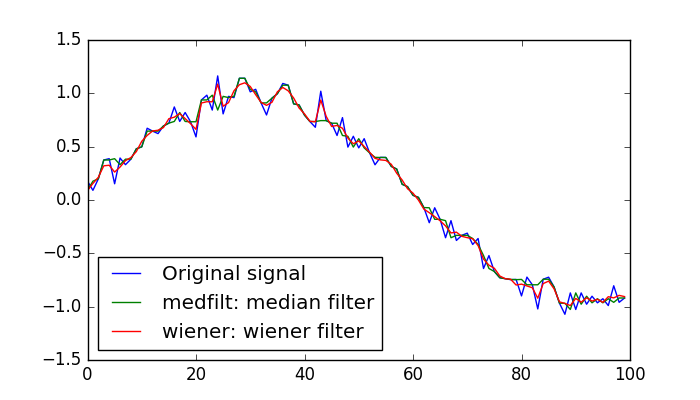
Apply a variety of turn-key filters to it, and plot the result
from scipy import signal
from matplotlib import pyplot as plt
plt.figure(figsize=(7, 4))
plt.plot(x, label='Original signal')
plt.plot(signal.medfilt(x), label='medfilt: median filter')
plt.plot(signal.wiener(x), label='wiener: wiener filter')

plt.legend(loc='best')
plt.show()
Total running time of the script: ( 0 minutes 0.039 seconds)