
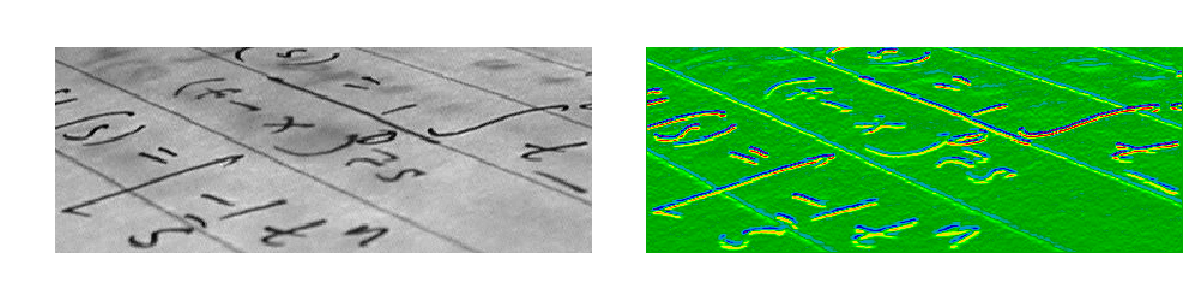
3.3.9.4. Computing horizontal gradients with the Sobel filter
This example illustrates the use of the horizontal Sobel filter, to compute horizontal gradients.
from skimage import data
from skimage import filters
import matplotlib.pyplot as plt

text = data.text()
hsobel_text = filters.sobel_h(text)

plt.figure(figsize=(12, 3))

plt.subplot(121)
plt.imshow(text, cmap='gray', interpolation='nearest')
plt.axis('off')
plt.subplot(122)
plt.imshow(hsobel_text, cmap='spectral', interpolation='nearest')
plt.axis('off')
plt.tight_layout()
plt.show()
Total running time of the script: ( 0 minutes 0.127 seconds)