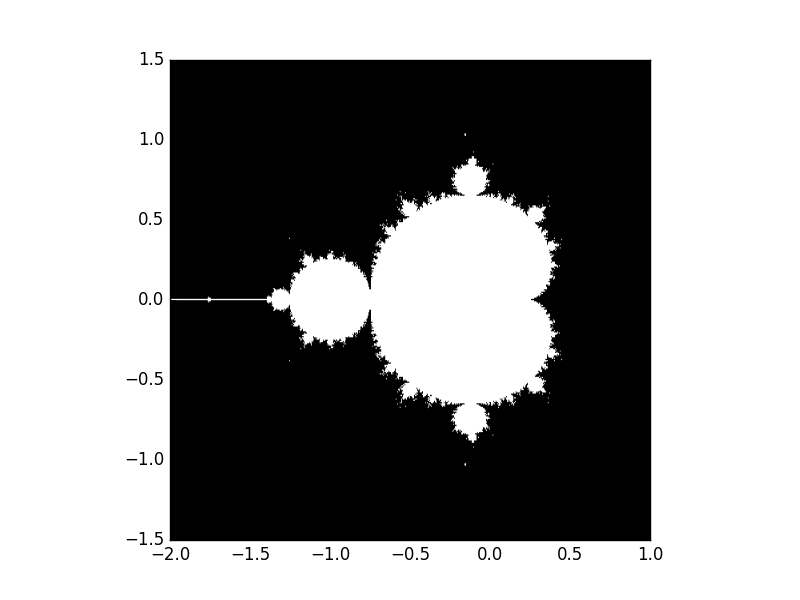
Mandelbrot set
Compute the Mandelbrot fractal and plot it

import numpy as np
import matplotlib.pyplot as plt
from numpy import newaxis

def compute_mandelbrot(N_max, some_threshold, nx, ny):
    # A grid of c-values
    x = np.linspace(-2, 1, nx)
    y = np.linspace(-1.5, 1.5, ny)

    c = x[:,newaxis] + 1j*y[newaxis,:]

    # Mandelbrot iteration

    z = c
    for j in range(N_max):
        z = z**2 + c

    mandelbrot_set = (abs(z) < some_threshold)

    return mandelbrot_set

mandelbrot_set = compute_mandelbrot(50, 50., 601, 401)

plt.imshow(mandelbrot_set.T, extent=[-2, 1, -1.5, 1.5])
plt.gray()
plt.show()
Total running time of the script: ( 0 minutes 0.134 seconds)
