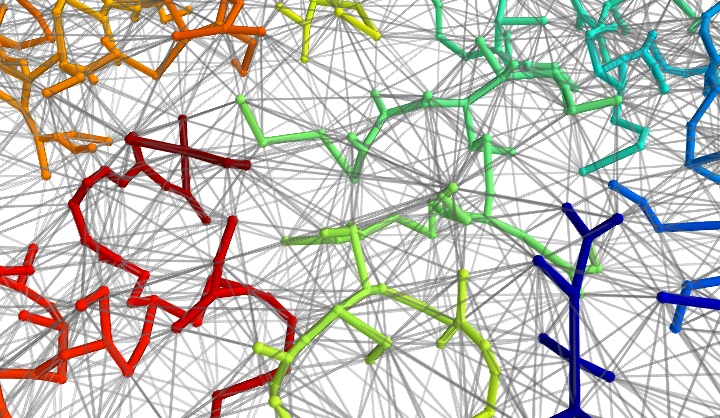
Gary Ruben came up with the excellent idea of visualizing the minimum spanning tree of a Delaunay tesselation in addition to Delaunay tessalation itself. After he sent me his code, I spent some times playing with it, because I found out that, with the right choice of visualization parameter, it gave me a nice understanding of what a minimum spanning tree was: a tree structure of minimal total length connecting all the vertices of the graphs, and embedded in the graph. On the visualization, the Delaunay graph is displayed in grey, and the minimum spanning tree in thick and colors.

The minimum spanning tree is calculated using Prim’s algorithms, on the fullly-connected distance-weighted graph of all points. One can clearly see that is it embedded in the Delaunay graph. In fact I have tested that calculating a minimum spanning tree on the Delaunay graph, or on the complete graph, gave the same result.
The code to create this picture can be found here.
Go Top