Mayavi2 is a rewrite of the original Mayavi application to make it easier to adapt and customize.
Mayavi2 uses, for its full-blown application, the Envisage framework. As a result it can both use envisage plugins (such as the logger and the python shell), and contribute to other plugins, thus providing a visualization engine.
The problem with a framework is that if you are not already using it, it comes at a cost. The cost of the Envisage2 framework is well-known: it is a bit tedious to learn. This is why Martin Chilvers (the Envisage author) has written Envisage3, but this is another story as Mayavi2 is currently based on Envisage2. To avoid forcing Envisage on people wanting to use Mayavi2, we have been working on decoupling the two. As I showed in a previous post, Mayavi2 can now be fully used without Envisage. But this is in the development version, and some people are stuck with the current release.
Today I would like to show how one can add some very simple customization to Mayavi2. The idea is to use the “-x” switch of Mayavi, that allows to execute a script in Mayavi2 after it has been started. Mayavi2 is thus started, the WxPython mainloop is running, and we can do better than a script, we can pop up a small UI. For this I will use traitsUI as I really like this library rather than raw WxPython (you can find a tutorial for this technology on my website). I will make a small dialog that uses Mayavi2 to create a 3D visualization, giving the user the possibility to change interactively the parameters of the visualization:
import numpy as N
from enthought.mayavi.mlab import plot3d, clf

from enthought.traits.api import HasTraits, Int
from enthought.traits.ui.api import View

class MyModel(HasTraits):
    n_mer   = Int(6)
    n_long  = Int(11)

    def _anytrait_changed(self):
        pi = N.pi
        dphi = pi/1000.
        phi = N.arange(0.0, 2*pi + 0.5*dphi, dphi, 'd')
        mu = phi*self.n_mer
        x = N.cos(mu)*(1+N.cos(self.n_long*mu/self.n_mer)*0.5)
        y = N.sin(mu)*(1+N.cos(self.n_long*mu/self.n_mer)*0.5)
        z = N.sin(self.n_long*mu/self.n_mer)*0.5
        t = N.sin(mu)
        # Realy ugly, but so much easier than modifying in place the
        # visualization
        clf()
        self.plot = plot3d(x, y, z, t,
                            tube_radius=0.025, colormap='Spectral')

    view = View('n_mer', 'n_long')

my_model = MyModel()
my_model._anytrait_changed()
my_model.edit_traits()
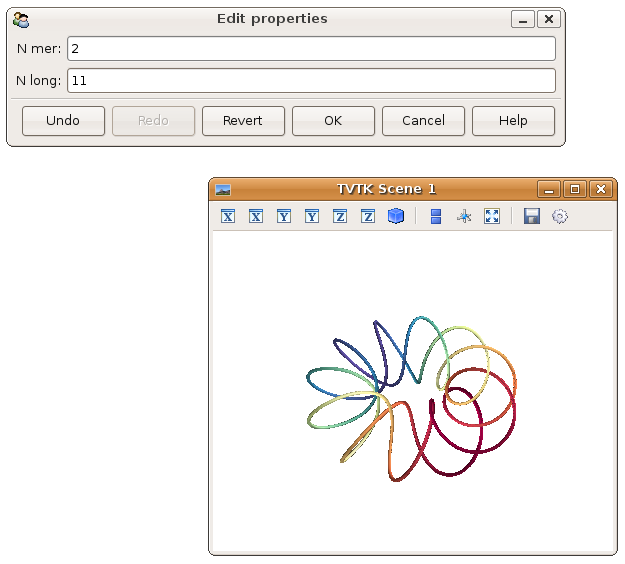
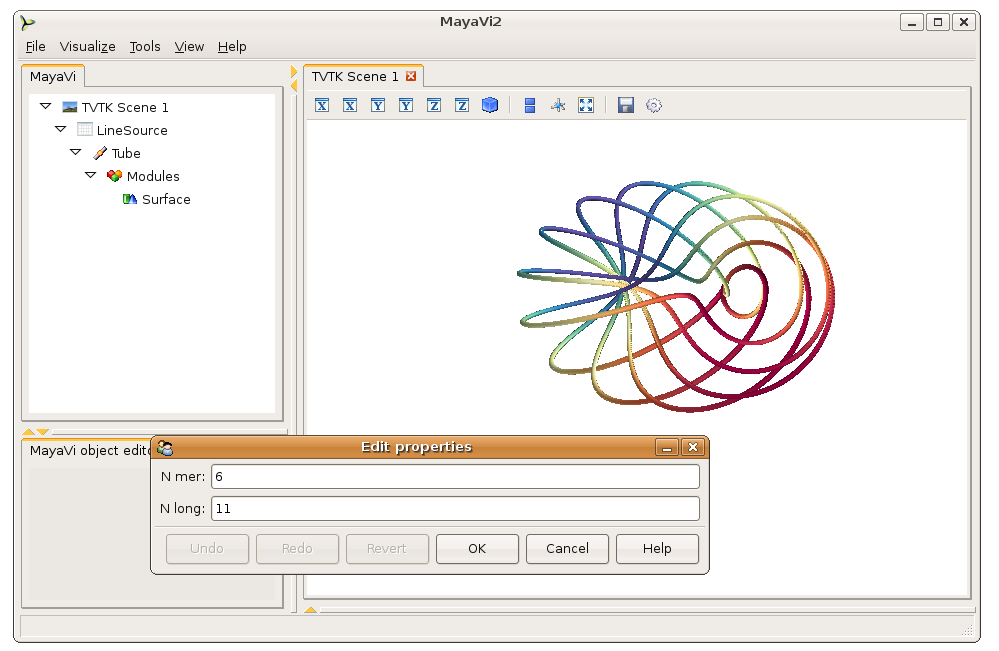
After the imports, the class definition is the object behind the dialog: two integer attributes that get displayed in the dialog, and a callback call when these attributes are modified. This callback uses Mayavi2’s mlab scripting interface to plot a nice 3D curve. The last line pops up the dialog that allows the user to interact with the visualization. This is very crude, but is a simple example. If you run this code using “mayavi2 -x”, the Mayavi2 application window appears with our visualization, and in addition the dialog to interact with it.
With the development version of Mayavi2, you can simply change the last line from ‘model.edit_traits()’ to ‘model.configure_traits()’ and the file can be run as a normal Python file: there is no need for the Envisage framework. As a result the UI is a bit simpler, which can be seen as a pro, or as a con, depending on what you want to do: