Interpreting linear models
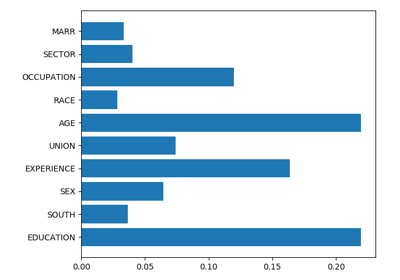
Interpreting random forests
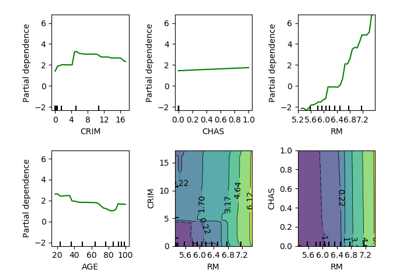
Partial dependency plots
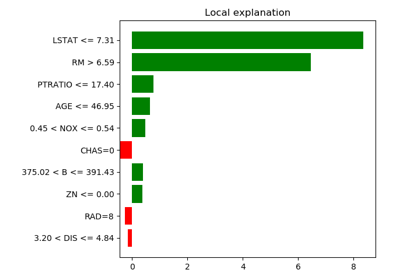
Black-box interpretation of models: LIME
Gallery generated by Sphinx-Gallery