
The title of this post is a lure: there won’t be a Mayavi image each week, because I would run out quickly. But it sounded cool.
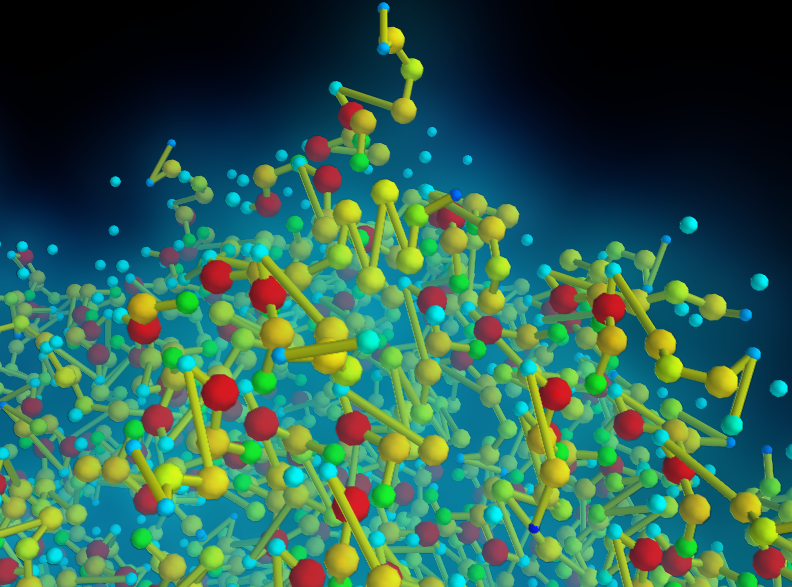
Anyway, here is an image of a graph, visualized with Mayavi. The graph is actually a protein structure, downloaded from the PDB. The Python script producing this visualization is checked in as a Mayavi example: https://svn.enthought.com/enthought/browser/Mayavi/trunk/examples/mayavi/protein.py
The part of the code to read the PDB file is actualy way longer than the visualization part.
I hope this script inspires people trying to visualize graphs. The combination of the GaussianSplatter filter and the volume rendering to create a halo renders really well, IMHO.
 Go Top